Fig. 4
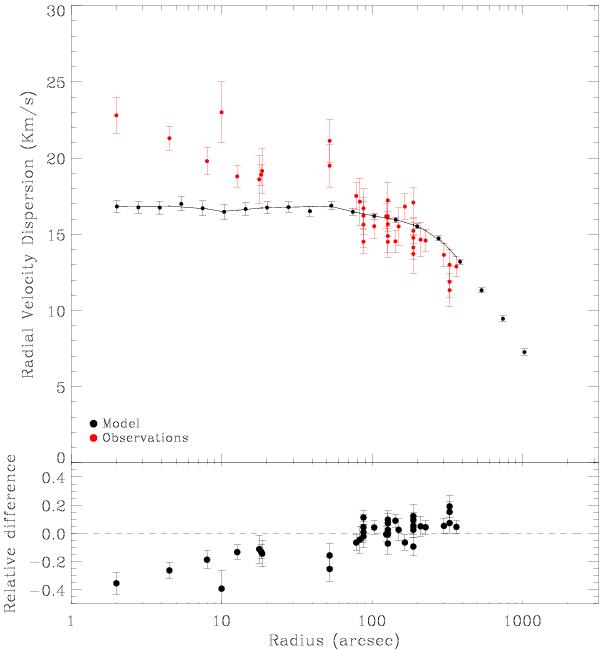
Upper panel: radial velocity dispersion profile vs. radius. The red points are the observed velocity dispersion relative to the kinematic center, taken from N10. The velocity dispersion of the best-fit no-IMBH model is shown in black. The model obviously does not fit the data around the center (for details see Sect. 4.1). Lower panel: the relative difference of our model and the observed profile.
Current usage metrics show cumulative count of Article Views (full-text article views including HTML views, PDF and ePub downloads, according to the available data) and Abstracts Views on Vision4Press platform.
Data correspond to usage on the plateform after 2015. The current usage metrics is available 48-96 hours after online publication and is updated daily on week days.
Initial download of the metrics may take a while.