Fig. 3
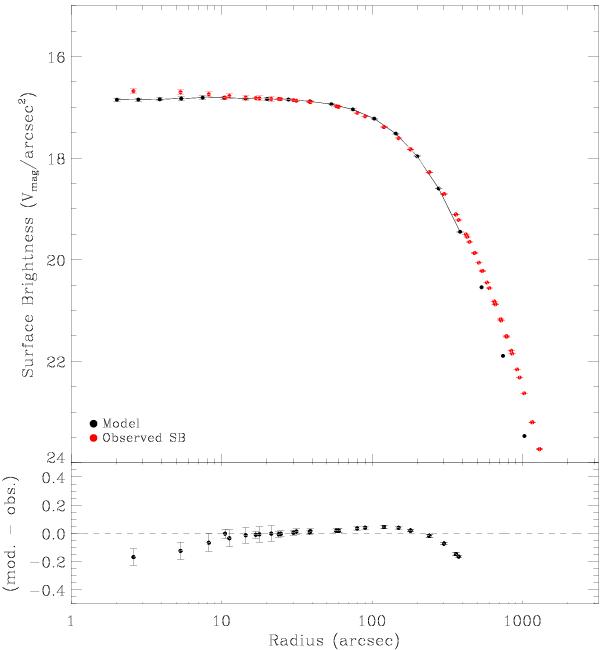
Upper panel: V-band surface brightness profile as a function of radius. The red points are the observed V-band surface brightness relative to the kinematic center in N10. The black points are the best no-IMBH model. This model fits the surface brightness data relatively well inside 400′′, except inside the central 10′′, where it ends up below the observations. The model points are connected inside 400′′ over which we calculate the χ2 values. Lower panel: residual of our model with respect to the observed profile.
Current usage metrics show cumulative count of Article Views (full-text article views including HTML views, PDF and ePub downloads, according to the available data) and Abstracts Views on Vision4Press platform.
Data correspond to usage on the plateform after 2015. The current usage metrics is available 48-96 hours after online publication and is updated daily on week days.
Initial download of the metrics may take a while.