Fig. 2
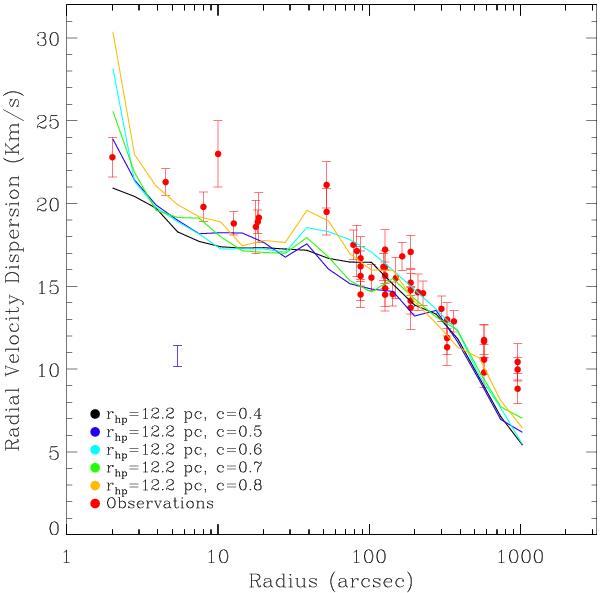
Radial velocity dispersion profiles as a function of radius for models with an IMBH mass 2% of the stellar mass with the same initial rhp. Observational data are shown as red points, and a sample uncertainty is shown in blue as in Fig. 1. Black, magenta, light blue, green and orange points are models with initial c = 0.4 to 0.8. All models have the same dispersion outside the core radius (~100′′) while clusters with higher concentration show higher velocity dispersion towards the center, as explained in Sect. 4.
Current usage metrics show cumulative count of Article Views (full-text article views including HTML views, PDF and ePub downloads, according to the available data) and Abstracts Views on Vision4Press platform.
Data correspond to usage on the plateform after 2015. The current usage metrics is available 48-96 hours after online publication and is updated daily on week days.
Initial download of the metrics may take a while.