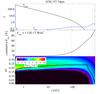
Fig. 8
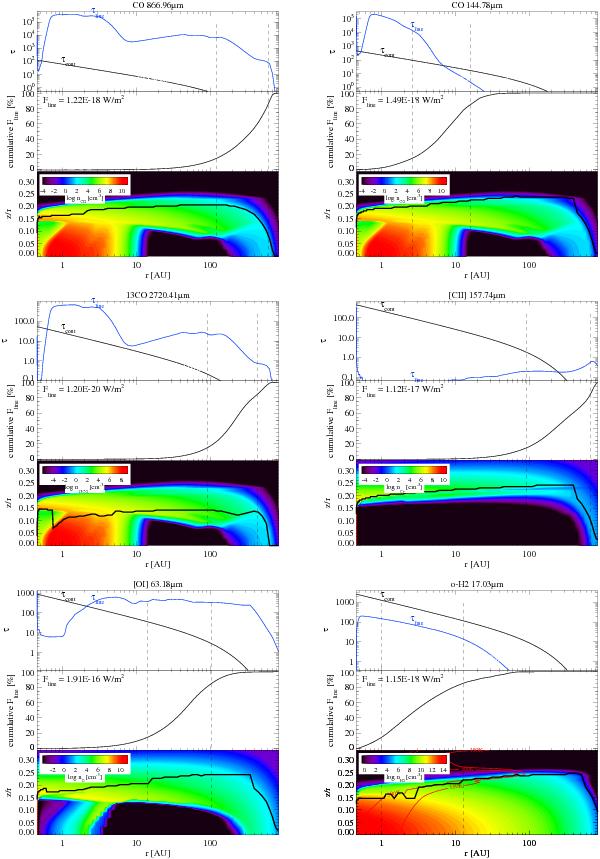
Spatial origin of the various gas emission lines in the preferred model (Col. 3 in Table 6). From top-left clockwise: CO J = 3−2, CO J = 18−17, [Cii] 157.74 μm, o-H2 S(1) (with red Tg contours), [Oi] 63.18 μm, 13CO J = 1–0. In each panel, the upper plot shows the line optical depth as a function of radius (blue line) and the continuum optical depth at the corresponding wavelength (black line). The middle plot shows the cumulative contribution to the total line flux with increasing radius. The lower plot shows the gas species number density, and the black line marks the cells that contribute the most to the line flux in their vertical column. The two vertical dashed lines indicate 15% and 85% of the radially cumulative face-on line flux respectively, i.e. 70% of the line flux originates from within the two dashed lines.
Current usage metrics show cumulative count of Article Views (full-text article views including HTML views, PDF and ePub downloads, according to the available data) and Abstracts Views on Vision4Press platform.
Data correspond to usage on the plateform after 2015. The current usage metrics is available 48-96 hours after online publication and is updated daily on week days.
Initial download of the metrics may take a while.