Fig. 6
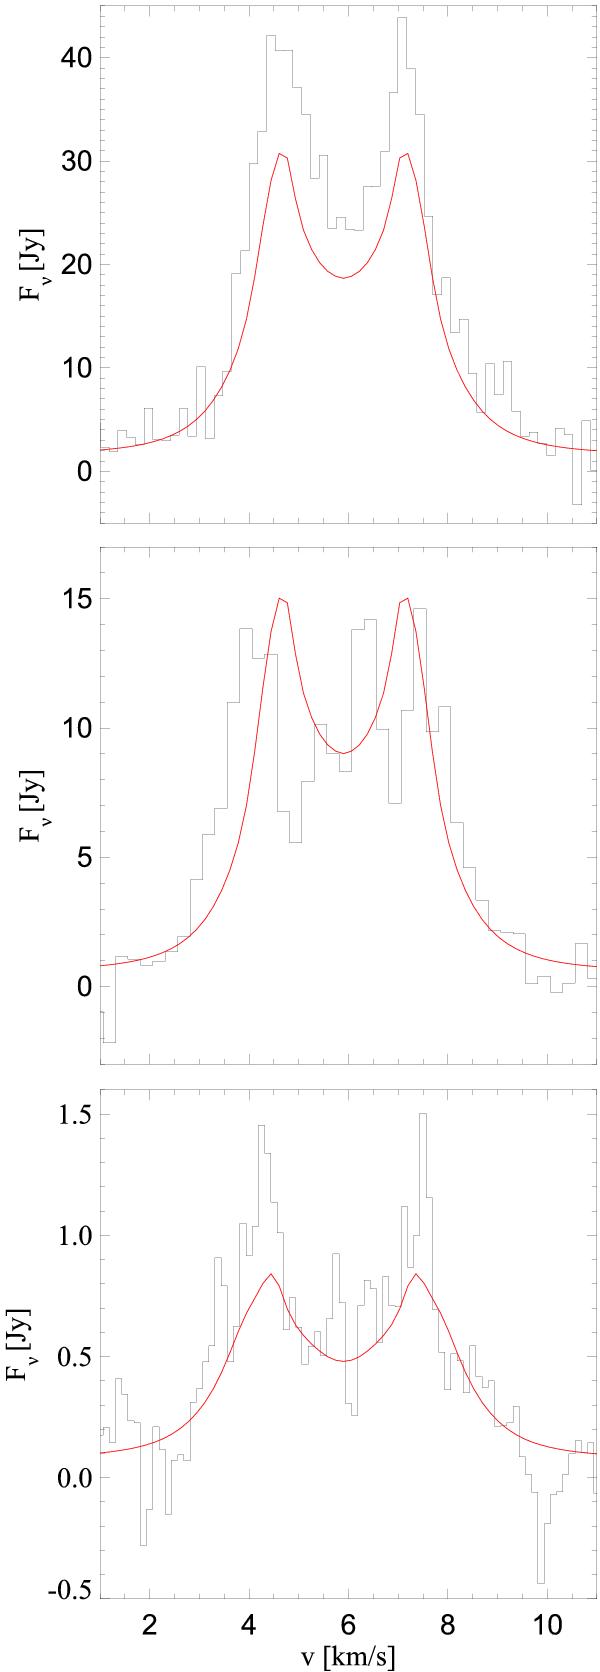
Plotted in black are the line profiles observed by Isella et al. (2007) for the 12CO J = 3–2 (upper panel), 12CO J = 2–1 (middle panel) and 13CO J = 1–0 (lower panel) transitions, with the corresponding profiles from the preferred disc model in red. This refers to a single simultaneous fit to the observed continuum and line data (Col. 3 in Table 6). Observed profiles are obtained by integrating over the whole disc.
Current usage metrics show cumulative count of Article Views (full-text article views including HTML views, PDF and ePub downloads, according to the available data) and Abstracts Views on Vision4Press platform.
Data correspond to usage on the plateform after 2015. The current usage metrics is available 48-96 hours after online publication and is updated daily on week days.
Initial download of the metrics may take a while.