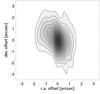
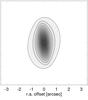
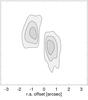
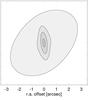
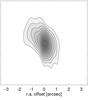
Fig. 5
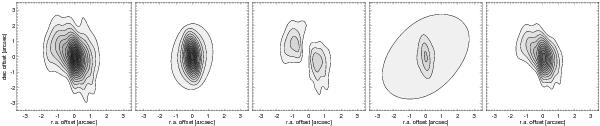
1.3 mm continuum emission maps for HD 163296.From left: observed map; emission map for preferred model (Col. 3 in Table 6); residuals for preferred model; emission map for power-law model (Col. 4 in Table 6); residuals for power-law model. Residuals computed by subtracting the model intensity from the observed intensity. Contours spaced at 12 mJy intervals, corresponding to [3,6,9,12,15,18,21,24,27,30,33,36,39,42,45] × σ.
Current usage metrics show cumulative count of Article Views (full-text article views including HTML views, PDF and ePub downloads, according to the available data) and Abstracts Views on Vision4Press platform.
Data correspond to usage on the plateform after 2015. The current usage metrics is available 48-96 hours after online publication and is updated daily on week days.
Initial download of the metrics may take a while.