Fig. 3
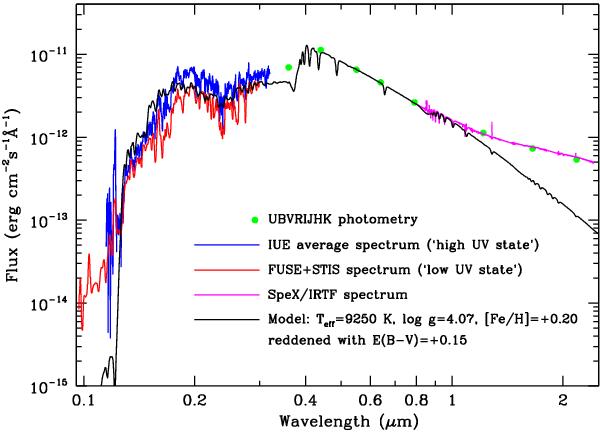
Spectral energy distribution for HD 163296. The green dots represent the fluxes corresponding to the UBVRIJHK photometry. The size of the dots is of the order or larger than the uncertainties. The IUE average spectrum and the FUSE+STIS spectrum are plotted in blue and red, respectively; the latter has been slightly smoothed to reduce the noise. The SpeX/IRTF spectrum is plotted in magenta. The black solid line is a photospheric model computed for the specific stellar parameters given in Table 3, reddened with E(B − V) = + 0.15 and normalized at the flux in V. See text for details.
Current usage metrics show cumulative count of Article Views (full-text article views including HTML views, PDF and ePub downloads, according to the available data) and Abstracts Views on Vision4Press platform.
Data correspond to usage on the plateform after 2015. The current usage metrics is available 48-96 hours after online publication and is updated daily on week days.
Initial download of the metrics may take a while.