Free Access
Fig. 12
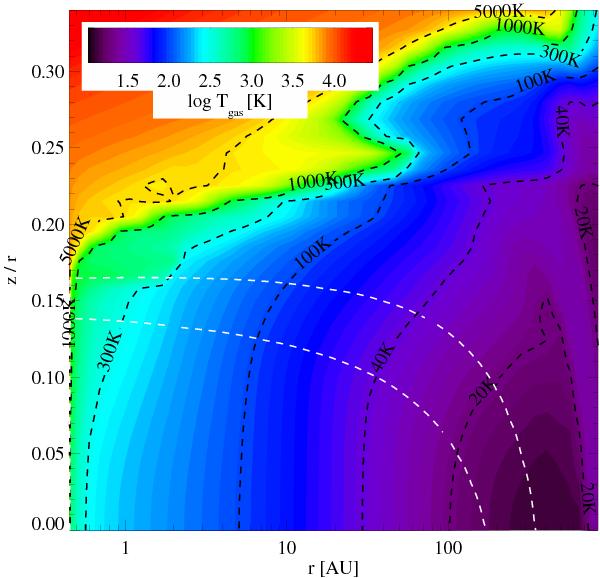
Gas temperature structure for the preferred model (Col. 3 in Table 6), irradiated by an additional X-ray spectral component with LX = 1029.6 erg s-1, as observed by Günther & Schmitt (2009) in HD 163296. This is in comparison to the right hand panel of Fig. 7, in which no X-ray spectral component is present.
Current usage metrics show cumulative count of Article Views (full-text article views including HTML views, PDF and ePub downloads, according to the available data) and Abstracts Views on Vision4Press platform.
Data correspond to usage on the plateform after 2015. The current usage metrics is available 48-96 hours after online publication and is updated daily on week days.
Initial download of the metrics may take a while.