Fig. 8
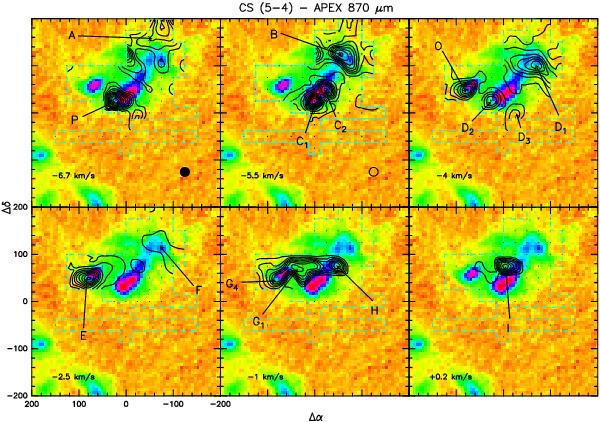
CS(5–4) emission (black and gray contours) superimposed on the 870 μm emission. The beam size of CS(5–4) is indicated by the filled circle, while the open circle indicates the APEX beam size. Each plot corresponds to a different VLSR. The VLSR of the clumps is indicated in the respective panel. The contours (in units of K km s-1) for each clump are (lowest (step) highest): (−6.7 km s-1) 0.19 (0.3) 2.59; (−5.5 km s-1, C) 0.20 (1.0) 10.20; (−5.5 km s-1, B) 0.19 (0.5) 3.69; (−4.0 km s-1) 0.19 (0.7) 4.39; (−2.5 km s-1) 0.18 (1.0) 8.18; (−1.0 km s-1) 0.17 (0.2) 1.37; and (+0.2 km s-1) 0.14 (0.1) 0.74. The lowest contour corresponds to the 3σ level in  .
.
Current usage metrics show cumulative count of Article Views (full-text article views including HTML views, PDF and ePub downloads, according to the available data) and Abstracts Views on Vision4Press platform.
Data correspond to usage on the plateform after 2015. The current usage metrics is available 48-96 hours after online publication and is updated daily on week days.
Initial download of the metrics may take a while.