Free Access
Fig. 7
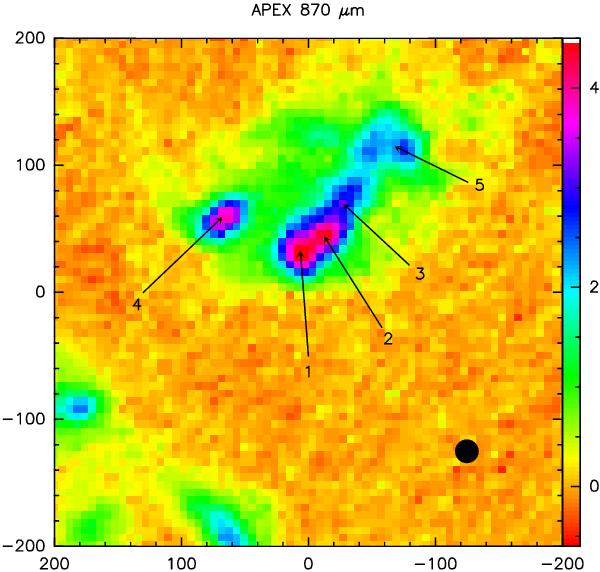
APEX image at 870 μm. The scale is expressed in Jy/beam. The APEX beam is shown as a filled circle. The locations of the main components identified are shown in the map. Component 5 was not fitted with a Gaussian, but was considered as a region of diffuse emission.
Current usage metrics show cumulative count of Article Views (full-text article views including HTML views, PDF and ePub downloads, according to the available data) and Abstracts Views on Vision4Press platform.
Data correspond to usage on the plateform after 2015. The current usage metrics is available 48-96 hours after online publication and is updated daily on week days.
Initial download of the metrics may take a while.