Fig. 3
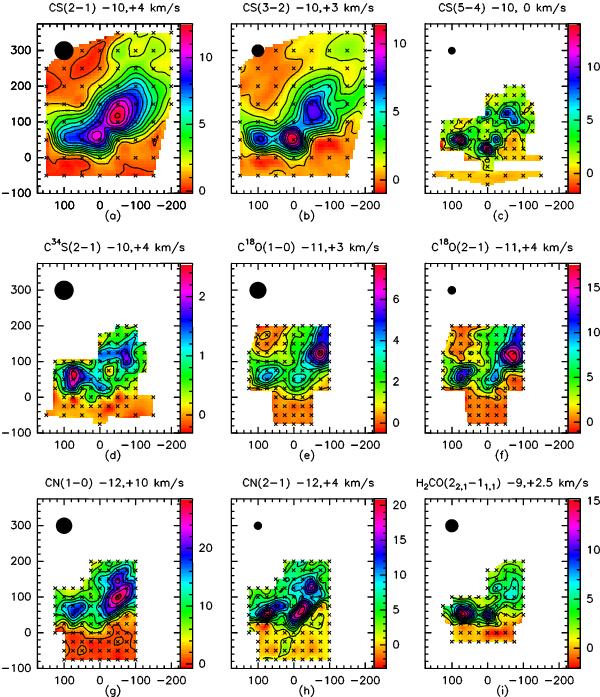
Maps of the integrated emission  of the different molecular species and transitions, within the whole velocity range of emission. The first contour is the 3σ level. Molecule, transition, and integration limits are indicated above each map. The beam size is indicated by the filled circle. The observed positions are marked with a cross. The contours levels (in units of K km s-1) are, respectively (lowest (step) highest): a) 0.41 (1.0) 12.41; b) 0.51 (1.0) 11.51; c) 0.89 (2.0) 12.89; d) 0.4 (0.4) 2.4; e) 0.47 (0.7) 7.47; f) 0.81 (2.0) 16.81; g) 0.98 (3.0) 27.98; h) 1.25 (2.0) 19.25; i) 0.92 (1.5) 15.92. Coordinates are offsets (arcsec) with respect to
 (J2000).
Current usage metrics show cumulative count of Article Views (full-text article views including HTML views, PDF and ePub downloads, according to the available data) and Abstracts Views on Vision4Press platform.
Data correspond to usage on the plateform after 2015. The current usage metrics is available 48-96 hours after online publication and is updated daily on week days.
Initial download of the metrics may take a while.