Fig. 7
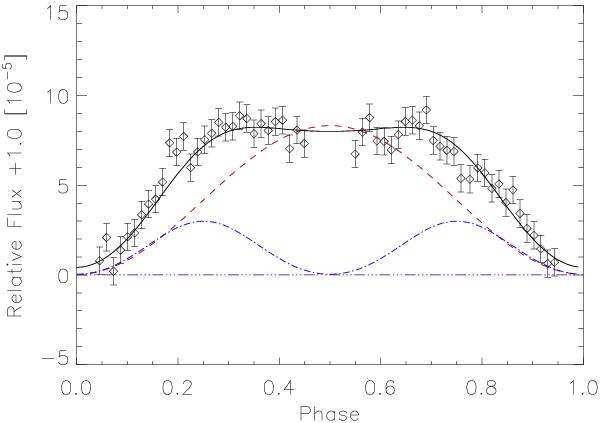
LC of HAT-P-7. The solid line shows the best fit solution of our synthetic model, i.e. including stellar ellipsoidal distortions and Doppler effect variations. The dashed red line refers to the reflected light component, the blue dotted line refers to the ellipsoidal variations and the purple, almost consant dashed line refers to the thermal emission. The Lambert sphere assumption produced the best fit.
Current usage metrics show cumulative count of Article Views (full-text article views including HTML views, PDF and ePub downloads, according to the available data) and Abstracts Views on Vision4Press platform.
Data correspond to usage on the plateform after 2015. The current usage metrics is available 48-96 hours after online publication and is updated daily on week days.
Initial download of the metrics may take a while.