Fig. 6
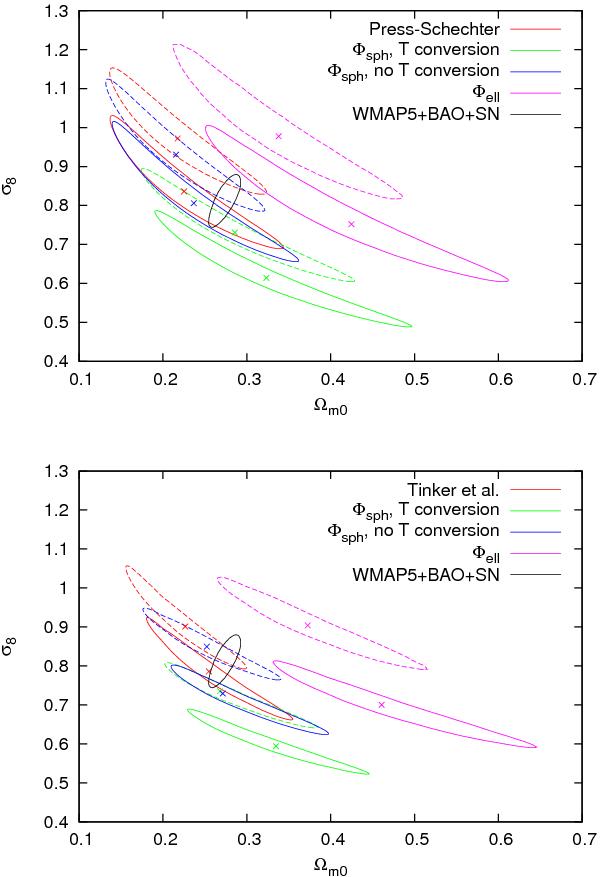
95% confidence contours for the various theoretical models presented in Sect. 5.2. The results for the potential-based temperature function assuming spherical-collapse dynamics are labelled with Φsph, those incorporating ellipsoidal collapse with Φell, respectively. While the solid curves represent the results of temperature functions that take into account merger effects, the dashed curves are for those which do not account for merging. The crosses mark the respective best-fit values. Parameter constraints from a joint analysis of WMAP5, BAO, and SN data inferred from Komatsu et al. (2009) are indicated by the black solid contour. Upper panel: Ikebe et al. (2002) data. Lower panel: Vikhlinin et al. (2009a) data.
Current usage metrics show cumulative count of Article Views (full-text article views including HTML views, PDF and ePub downloads, according to the available data) and Abstracts Views on Vision4Press platform.
Data correspond to usage on the plateform after 2015. The current usage metrics is available 48-96 hours after online publication and is updated daily on week days.
Initial download of the metrics may take a while.