Free Access
Fig. 3
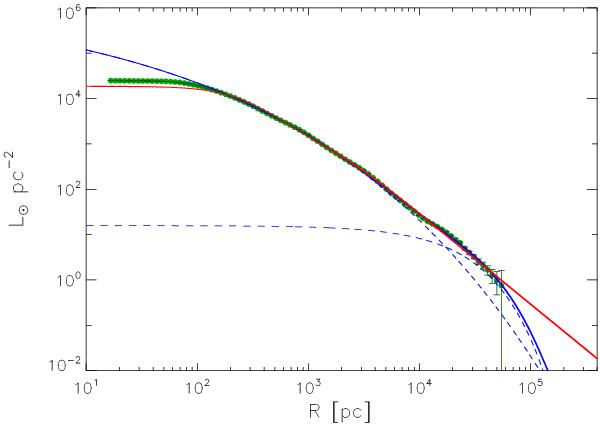
Surface brightness profile of NGC 7507. The green dots indicate the R photometry in units of L⊙ pc-2. The dashed blue lines represent the two Sersic profiles, while the solid blue line is their sum. The red solid line represents the double β model.
Current usage metrics show cumulative count of Article Views (full-text article views including HTML views, PDF and ePub downloads, according to the available data) and Abstracts Views on Vision4Press platform.
Data correspond to usage on the plateform after 2015. The current usage metrics is available 48-96 hours after online publication and is updated daily on week days.
Initial download of the metrics may take a while.