Fig. 5
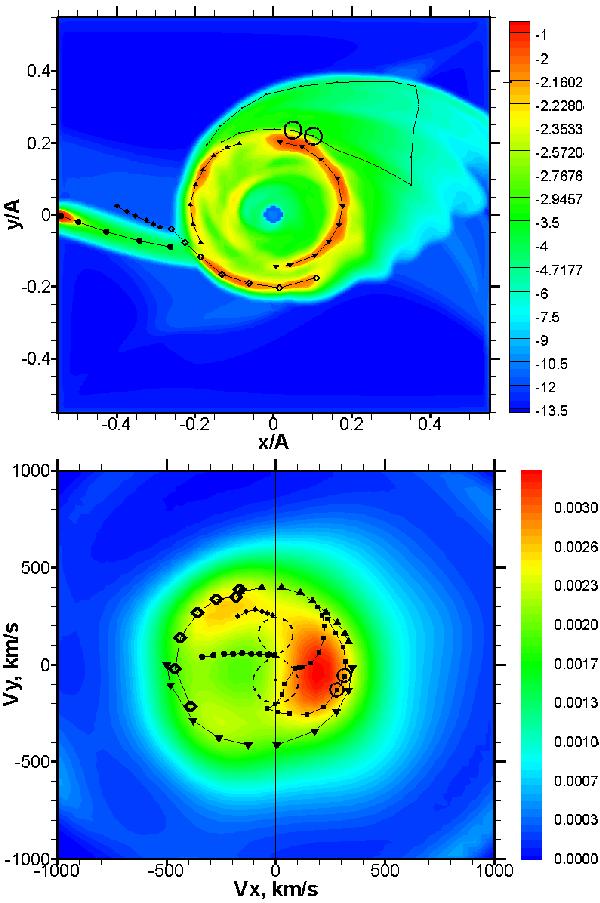
Intensity distribution in the spatial coordinates (Bisikalo et al. 2008) (upper panel) and Hβ Doppler map with the markers denoting main gas dynamic features. The markers in the upper panel denote the following gas dynamic features: lines with triangles correspond to the arms of the spiral tidal shock; the line with hollow diamonds denotes the “hot line”; the line with the filled diamonds lies in the region along the stream from the L1 point; and the thin solid line encloses the region of the matter near the bow shock. Two open circles on this line are placed to mark a boundary between the disk and asymmetric region (see explanation in the text). In the lower panel, we plot the same markers transferred into the velocity.
Current usage metrics show cumulative count of Article Views (full-text article views including HTML views, PDF and ePub downloads, according to the available data) and Abstracts Views on Vision4Press platform.
Data correspond to usage on the plateform after 2015. The current usage metrics is available 48-96 hours after online publication and is updated daily on week days.
Initial download of the metrics may take a while.