Fig. 7
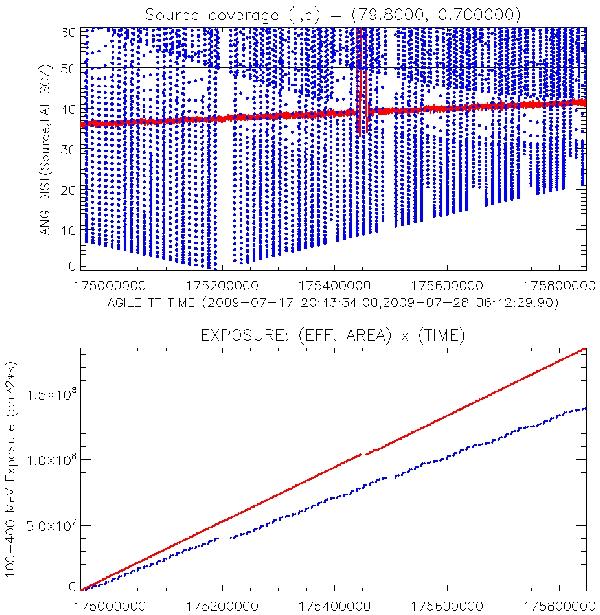
Different pointing strategies of Cyg X-3for AGILE-GRID (in red) and Fermi-LAT (in blue). Upper panel: time evolution of the instrument off-axis angle with respect to the fixed Cyg X-3 position during the period 2009 Jul. 18–28 when the AGILE operates in pointing mode. The curve in blue show the off-axis angle evolution for the all-sky scanning pointing strategy of Fermi-LAT. The curve in red show the off-axis angle for the AGILE-GRID fixed pointing strategy in 2009 Jul. Bottom panel: time evolution of the cumulative exposure between 100 MeV and 400 MeV for Fermi-LAT (blue curve, using public data and Pass 6 Version 3 Front photons Instrument Response Function) and AGILE-GRID (red curve) assuming a starting time on 2009 Jul. 18.
Current usage metrics show cumulative count of Article Views (full-text article views including HTML views, PDF and ePub downloads, according to the available data) and Abstracts Views on Vision4Press platform.
Data correspond to usage on the plateform after 2015. The current usage metrics is available 48-96 hours after online publication and is updated daily on week days.
Initial download of the metrics may take a while.