Fig. 5
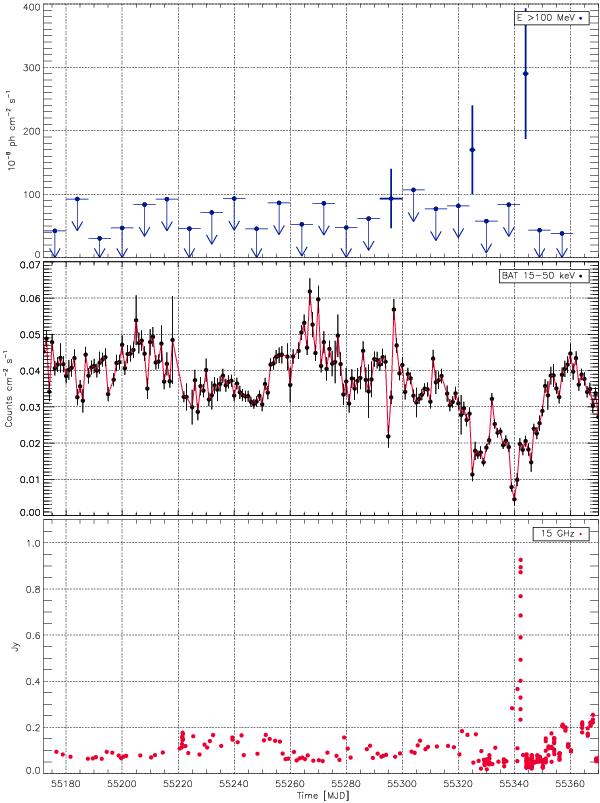
Simultaneous AGILE/GRID, Swift /BAT and radio monitoring data of Cyg X-3during the uninterrupted 18-months in the period 2009 Dec.–2011 May. Top panel: the AGILE-GRID γ-ray lightcurve for E > 100 MeV. Second panel: Swift /BAT lightcurve (in counts per second in the energy range 15–50 keV). Third panel: AMI-LA radio flux monitoring of Cyg X-3 at 15 GHz.
Current usage metrics show cumulative count of Article Views (full-text article views including HTML views, PDF and ePub downloads, according to the available data) and Abstracts Views on Vision4Press platform.
Data correspond to usage on the plateform after 2015. The current usage metrics is available 48-96 hours after online publication and is updated daily on week days.
Initial download of the metrics may take a while.