Fig. 3
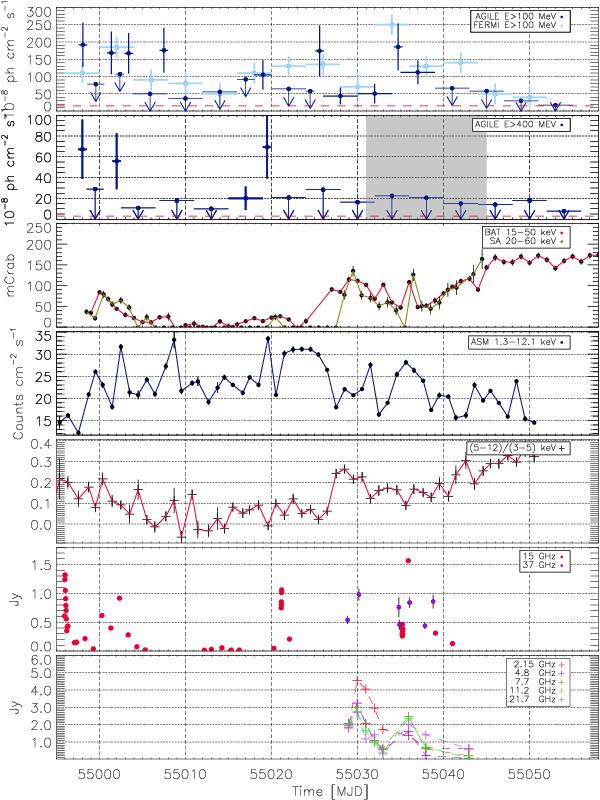
AGILE/GRID, AGILE/SA, Fermi/LAT, Swift/BAT, XTE/ASM, AMI-LA, RATAN-600 and Metsähovi Radio Observatory data of Cyg X-3during the uninterrupted 2-months period 2009 Jun.–Jul. Panel 1 (top): the AGILE-GRID γ-ray light curve with a variable window time to put in evidence the Cyg X-3 flares of 1-day timescale, the other data and upper-limits are determined with 1- 2- or 4-day time intervals; the Fermi light curve of 4-days timescale. E > 100 MeV. Panel 2: the AGILE-GRID γ-ray light curve for E > 400 MeV and the coverage of MAGIC observation (gray area). Panel 3: the hard X-ray light curve as monitored by BAT (15–50 keV) and by Super-AGILE (20–60 keV) with a daily timescale bin. Panel 4: the soft X-ray light curve as monitored by XTE-ASM (1.3–12.1 keV) for a 1-day integration time bin. Panel 5: the ASM hardness ratio (5−12keV)/(3−5keV) data. Panel 6: AMI-LA radio flux monitoring of Cyg X-3 at 15 GHz and the Metsähovi Radio Observatory data at 37 GHz. Panel 7: RATAN-600 radio telescope data at different frequencies. The AGILE/GRID γ-ray upper limits are at the 2 − σ level, the flux error bars are 1 − σ values.
Current usage metrics show cumulative count of Article Views (full-text article views including HTML views, PDF and ePub downloads, according to the available data) and Abstracts Views on Vision4Press platform.
Data correspond to usage on the plateform after 2015. The current usage metrics is available 48-96 hours after online publication and is updated daily on week days.
Initial download of the metrics may take a while.