Fig. 1
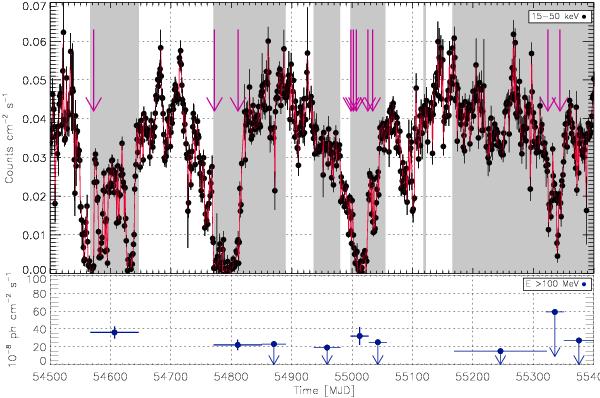
(Top panel) Swift /BAT lightcurve (in counts per second in the energy range 15–50 keV) and AGILE-GRID γ-ray flares for E > 100 MeV as a function of time. The red arrows mark the dates of major γ-ray flares of Cyg X-3: MJD 54 572, 54 772, 54 811, 54 998, 55 001, 55 003, 55 007, 55 025, 55 034, 553 24, 55 343. Gray areas show the interval of good AGILE γ-ray exposure of Cyg X-3. (Bottom panel) Average γ-ray flux from Cyg X-3region in hard and soft X-ray state for E > 100 MeV.
Current usage metrics show cumulative count of Article Views (full-text article views including HTML views, PDF and ePub downloads, according to the available data) and Abstracts Views on Vision4Press platform.
Data correspond to usage on the plateform after 2015. The current usage metrics is available 48-96 hours after online publication and is updated daily on week days.
Initial download of the metrics may take a while.