Fig. 9
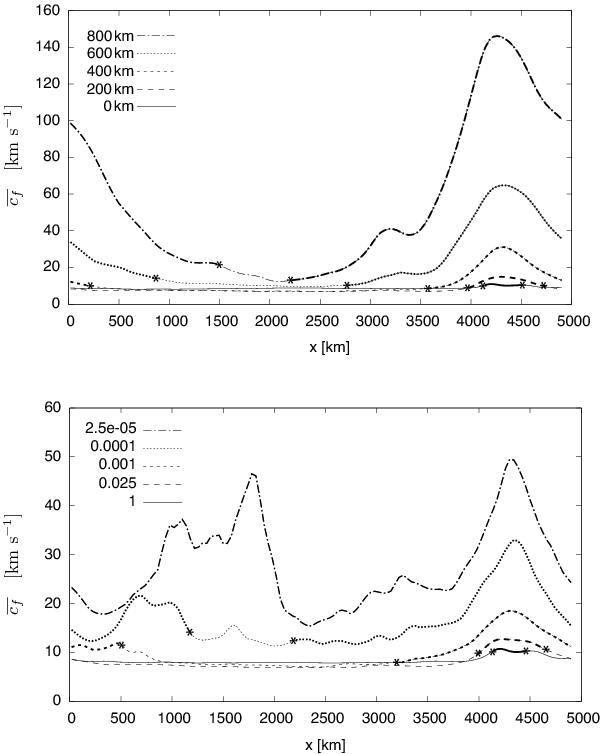
Time-averaged phase speed of the fast mode at selected fixed geometrical heights (top panel) and selected optical depth levels τ1 = 1, τ2 = 0.025, τ3 = 0.001, τ4 = 0.0001, and τ5 = 2.5 × 10⁻⁵ (bottom panel). The bold lines indicate the regime where cA/cs > 1, while the thin lines represent the regime where cA/cs < 1. The asterisks mark the locations where the respective height levels cross the equipartition level.
Current usage metrics show cumulative count of Article Views (full-text article views including HTML views, PDF and ePub downloads, according to the available data) and Abstracts Views on Vision4Press platform.
Data correspond to usage on the plateform after 2015. The current usage metrics is available 48-96 hours after online publication and is updated daily on week days.
Initial download of the metrics may take a while.