Free Access
Fig. 8
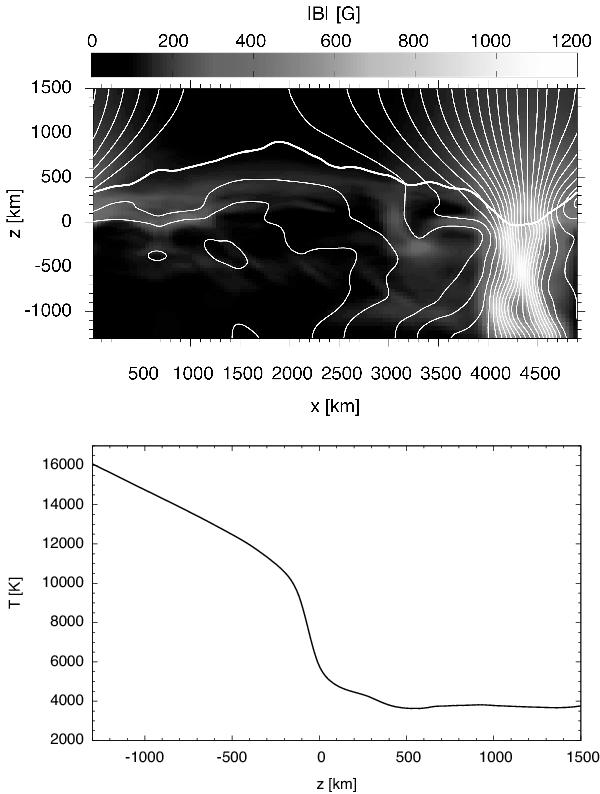
Top: magnetic field averaged over the entire time span of 1500 s. The solid curves represent magnetic field lines. The heavy white contour displays the time-averaged position of the equipartition level. Bottom: temporally and horizontally averaged temperature stratification of the background model.
Current usage metrics show cumulative count of Article Views (full-text article views including HTML views, PDF and ePub downloads, according to the available data) and Abstracts Views on Vision4Press platform.
Data correspond to usage on the plateform after 2015. The current usage metrics is available 48-96 hours after online publication and is updated daily on week days.
Initial download of the metrics may take a while.