Fig. 3
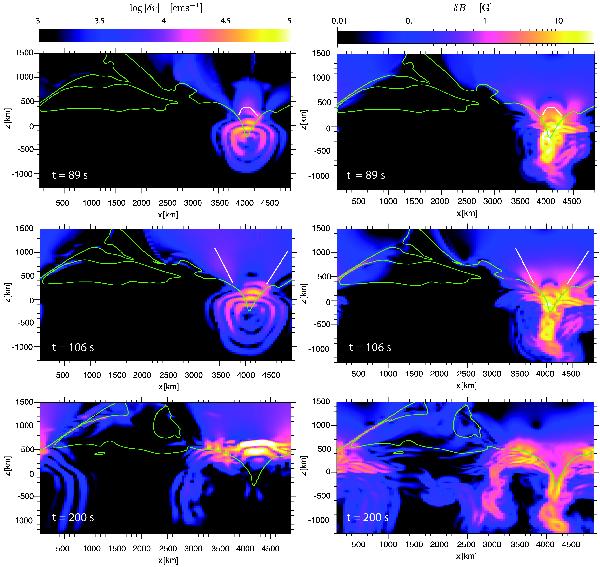
Time sequences of the propagation of a wave launched at position (ii) of Fig. 1a. Time increases from top to bottom. Left column: perturbation of the absolute velocity, δ|v|. Right column: perturbation of the absolute magnetic field, δ|B|. The green contours (thin white in the print edition) display the equipartition level, cs = cA. The white curves indicate the position of a single wave front of the fast magnetic mode and its evolution in time. In the last row, the fast magnetic mode (in the region where cA/cs > 1) has already been refracted and wave fronts of constant phase cannot be clearly identified. δ|v|(t) is available as an mpeg animation in the online edition of the article.
Current usage metrics show cumulative count of Article Views (full-text article views including HTML views, PDF and ePub downloads, according to the available data) and Abstracts Views on Vision4Press platform.
Data correspond to usage on the plateform after 2015. The current usage metrics is available 48-96 hours after online publication and is updated daily on week days.
Initial download of the metrics may take a while.