Fig. 1
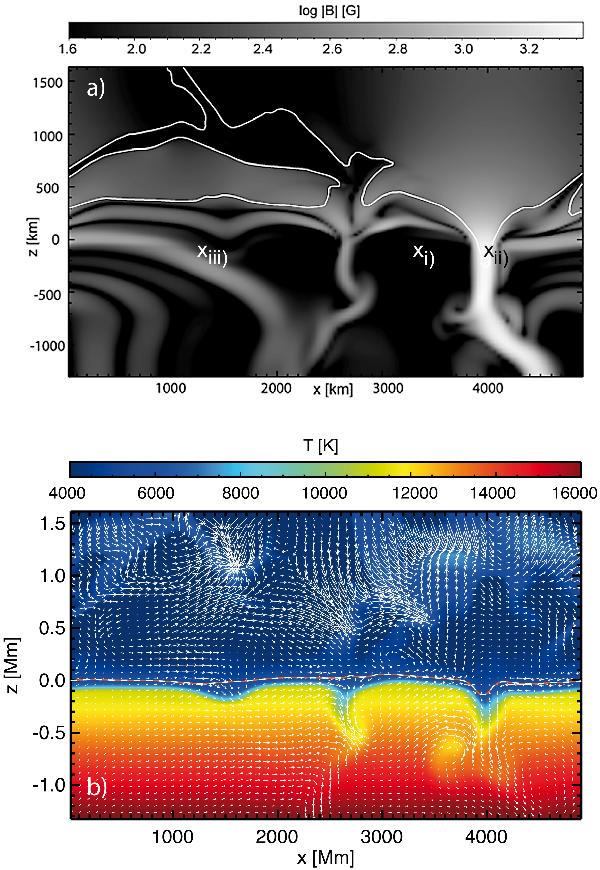
a) Magnetic setup at the start of the simulation showing the logarithm of the magnetic field strength in gauss. The white contour displays the equipartition level, where cs = cA. The crosses indicate three different locations of local wave excitation, individually discussed in Sect. 3. b) Corresponding temperature in Kelvin (colors) and velocity (arrows). The longest arrows correspond to 10 km s-1. The dashed curve indicates optical depth τc = 1.
Current usage metrics show cumulative count of Article Views (full-text article views including HTML views, PDF and ePub downloads, according to the available data) and Abstracts Views on Vision4Press platform.
Data correspond to usage on the plateform after 2015. The current usage metrics is available 48-96 hours after online publication and is updated daily on week days.
Initial download of the metrics may take a while.