Open Access
Fig. 8
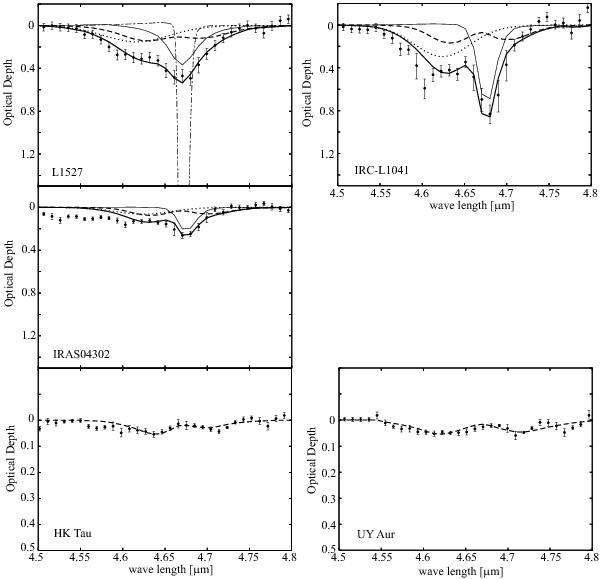
The spectra around the CO ice absorption band fitted by a combination (thick solid line) of CO gas (dashed line), XCN feature (dotted line), and CO ice on the CDE grain model (thin solid line). The dot-dashed line in the panel of L1527 depicts the CO ice feature before the convolution with the N3 profile.
Current usage metrics show cumulative count of Article Views (full-text article views including HTML views, PDF and ePub downloads, according to the available data) and Abstracts Views on Vision4Press platform.
Data correspond to usage on the plateform after 2015. The current usage metrics is available 48-96 hours after online publication and is updated daily on week days.
Initial download of the metrics may take a while.