Open Access
Fig. 6
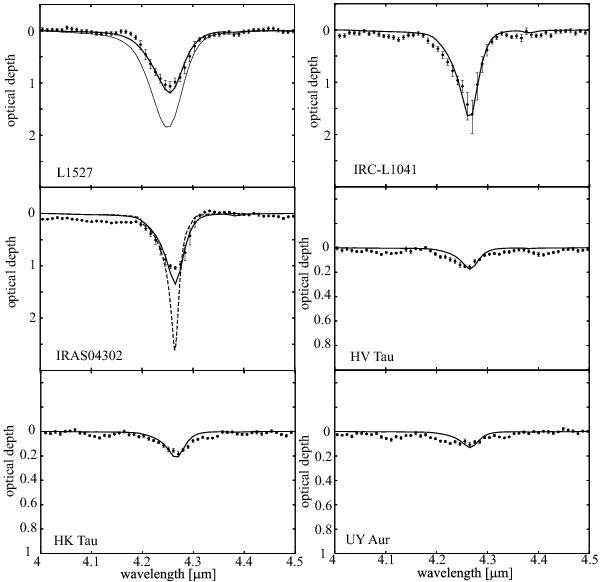
Spectra fitted by the convolved laboratory spectrum of CO2 ice (solid line). The dashed lines depict the CO2 feature before convolution. In the panel of L1527, the 4.38 μm feature is fitted by the convolved laboratory spectrum of 13CO2 (thin solid line).
Current usage metrics show cumulative count of Article Views (full-text article views including HTML views, PDF and ePub downloads, according to the available data) and Abstracts Views on Vision4Press platform.
Data correspond to usage on the plateform after 2015. The current usage metrics is available 48-96 hours after online publication and is updated daily on week days.
Initial download of the metrics may take a while.