Fig. 6
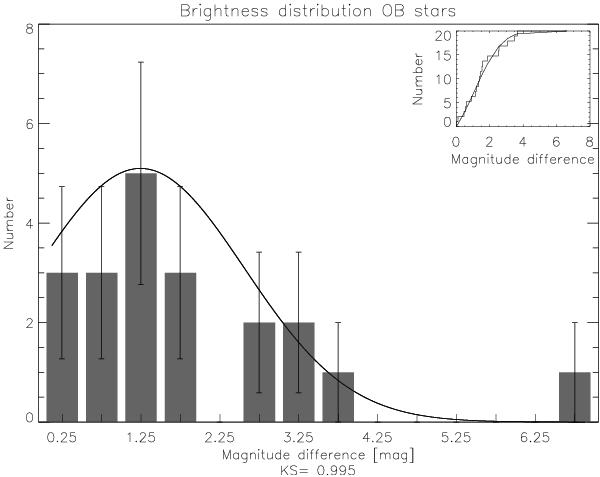
Histogram of the distribution of magnitude differences between binary components in the OB sample. Overplotted is the best-fit model. The probability is displayed in the bottom of the image. The inset shows the cumulative distribution (steps) on which the fit (curve) was performed. See text for explanations about why a Gaussian fit passes the KS test well while a Bayesian analysis cannot find a significant evidience for either a Gaussian or a Uniform distribution.
Current usage metrics show cumulative count of Article Views (full-text article views including HTML views, PDF and ePub downloads, according to the available data) and Abstracts Views on Vision4Press platform.
Data correspond to usage on the plateform after 2015. The current usage metrics is available 48-96 hours after online publication and is updated daily on week days.
Initial download of the metrics may take a while.