Fig. 3
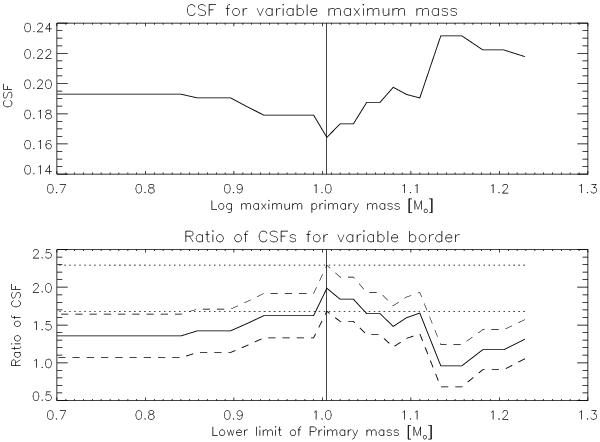
Upper panel: the CSF as function of the maximum primary mass. Lower panel: the ratio of two CSFs. One CSF is calculated for the sample of targets with the value on the x-axis taken as maximum mass, the other one is calculated for the remaining targets. The ratio is calculated as the value of the CSF of the sample of the more massive targets over the value of the CSF of the less massive sample. The dotted lines indicate the error range at the position of the peak and prove that the peak is indeed significant.
Current usage metrics show cumulative count of Article Views (full-text article views including HTML views, PDF and ePub downloads, according to the available data) and Abstracts Views on Vision4Press platform.
Data correspond to usage on the plateform after 2015. The current usage metrics is available 48-96 hours after online publication and is updated daily on week days.
Initial download of the metrics may take a while.