Fig. 2
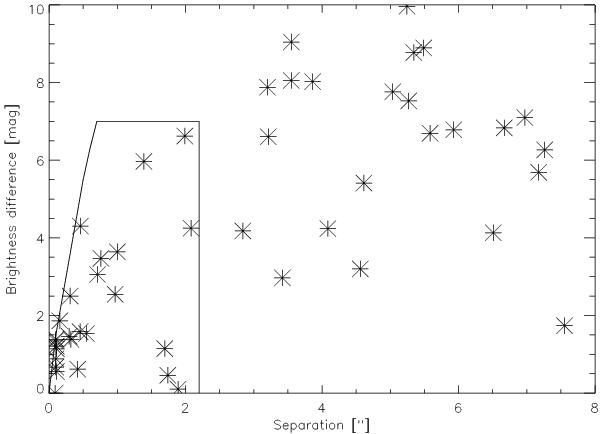
Brightness vs. separation of the companion stars. The solid curve marks the sample of companions that we assumed to be physical. The left border of the sample is given by the detection limit as a function of brightness. The right border is defined by the change in the behavior of the stellar density with separation (see text).
Current usage metrics show cumulative count of Article Views (full-text article views including HTML views, PDF and ePub downloads, according to the available data) and Abstracts Views on Vision4Press platform.
Data correspond to usage on the plateform after 2015. The current usage metrics is available 48-96 hours after online publication and is updated daily on week days.
Initial download of the metrics may take a while.