Free Access
Fig. 7
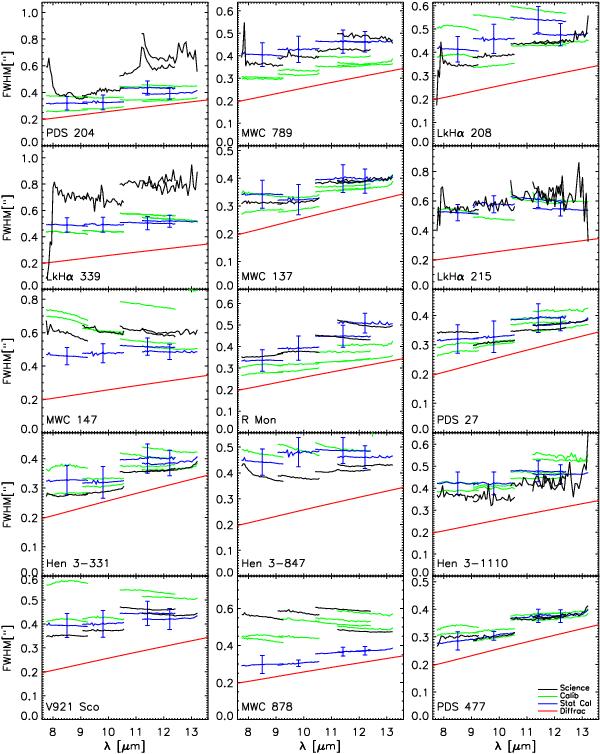
Size of all our targets as a function of wavelength (black lines). Plotted in green are calibration measurements taken immediately before or after the science exposures. Plotted in blue is the statistical calibrator as determined from the entire sample of calibrators. The red line is the theoretical diffraction limit.
Current usage metrics show cumulative count of Article Views (full-text article views including HTML views, PDF and ePub downloads, according to the available data) and Abstracts Views on Vision4Press platform.
Data correspond to usage on the plateform after 2015. The current usage metrics is available 48-96 hours after online publication and is updated daily on week days.
Initial download of the metrics may take a while.