Fig. 6
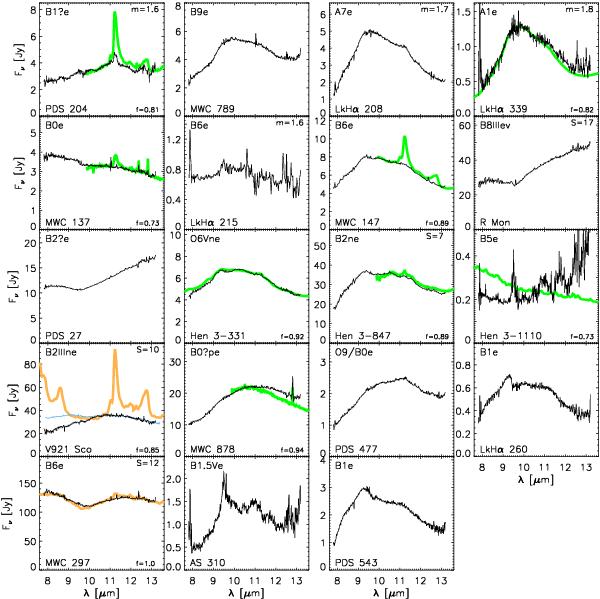
VISIR N-band spectra of our targets. Overplotted are Spitzer spectra (thick green), ISO spectra (thick orange), and a TIMMI2 spectrum (blue) where available. These spectra were scaled to the VISIR spectrum with the factor (f) indicated in the bottom right for the Spitzer and ISO spectra. Indicated in the top right are quality parameters, when they reach levels of concern. If the airmass (m) exceeded 1.5, the value is indicated. When the sensitivity value (S) was greater than five times the median value of the performance history of VISIR (i.e. poor performance), S is indicated in units of this median sensitivity value.
Current usage metrics show cumulative count of Article Views (full-text article views including HTML views, PDF and ePub downloads, according to the available data) and Abstracts Views on Vision4Press platform.
Data correspond to usage on the plateform after 2015. The current usage metrics is available 48-96 hours after online publication and is updated daily on week days.
Initial download of the metrics may take a while.