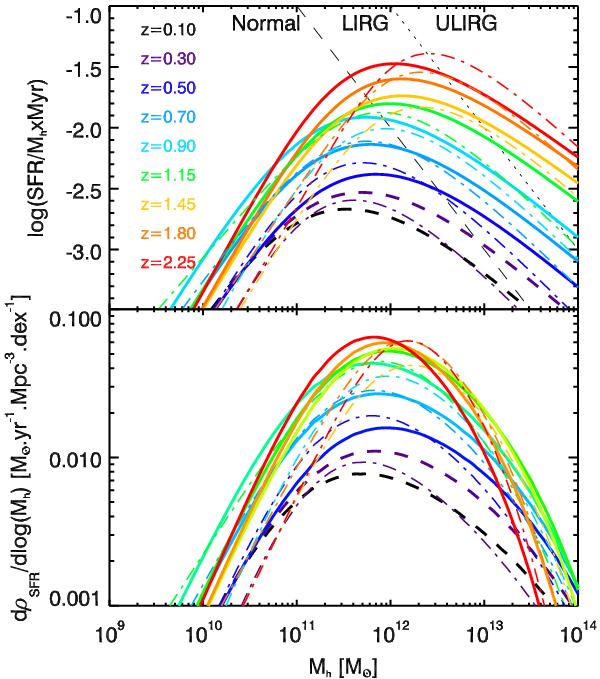
Fig. 3

Upper panel: ratio between SFR and halo mass as a function of halo mass at various redshifts. Solid lines: results from a direct abundance matching of the LFIR and the HMF (we use dashed lines at z ≤ 0.3 where neglecting the quiescent galaxies has a significant impact, see Sect. 5). Dotted-dashed lines: results from the abundance matching between the SMF and the HMF, combined with the best-fit of the sSFR-M⋆ relation by Karim et al. (2011). Thin-dashed and dotted lines are the limits between the normal and LIRG, and the LIRG and ULIRG regime, respectively. Lower panel: contribution of the various halo masses to the SFR density.
Current usage metrics show cumulative count of Article Views (full-text article views including HTML views, PDF and ePub downloads, according to the available data) and Abstracts Views on Vision4Press platform.
Data correspond to usage on the plateform after 2015. The current usage metrics is available 48-96 hours after online publication and is updated daily on week days.
Initial download of the metrics may take a while.


