Fig. 2
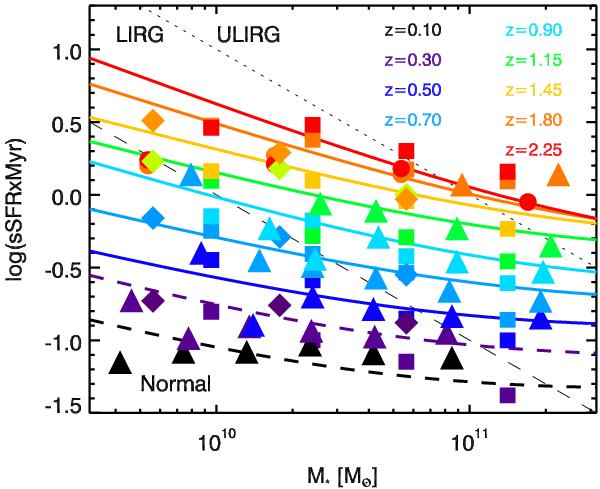
sSFR as a function of stellar mass at various redshifts. Solid lines: our results based on the abundance matching technique (we use dashed lines at z ≤ 0.3 where neglecting the quiescent galaxies have a significant impact, see Sect. 5). Filled squares: measurements from Karim et al. (2011) obtained by radio stacking at z = 0.3, 0.5, 0.7, 0.9, 1.1, 1.4, 1.8, and 2.25. Filled diamonds: measurement from Rodighiero et al. (2010) obtained by Herschel/PACS stacking at z = 0.25, 0.75, 1.25, and 1.75. Filled circles: measurements from Bauer et al. (2011) obtained using UV measurements at z = 1.75 and 2.25. Filled triangles: measurements of Oliver et al. (2010) from Spitzer/MIPS stacking at z = 0.1, 0.3, 0.5, 0.7, 0.9, 1.1, 1.35, 1.75. The error bars have not been plotted for clarity, but they roughly match the symbol size. Thin-dashed and dotted lines are the limits between the normal and LIRG (luminous infrared galaxies, 1011 L⊙ < LIR < 1012 L⊙), and the LIRG and ULIRG (ultra luminous infrared galaxies, LIR > 1012 L⊙) regime, respectively.
Current usage metrics show cumulative count of Article Views (full-text article views including HTML views, PDF and ePub downloads, according to the available data) and Abstracts Views on Vision4Press platform.
Data correspond to usage on the plateform after 2015. The current usage metrics is available 48-96 hours after online publication and is updated daily on week days.
Initial download of the metrics may take a while.