Fig. 3
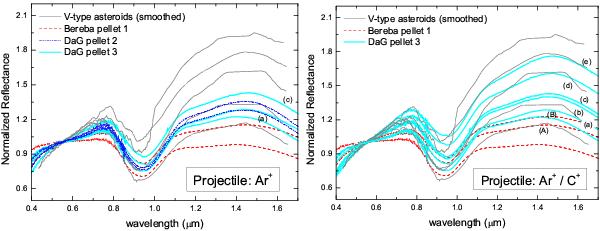
Comparison between VIS-NIR spectra of V-type asteroids with spectra of DaG and Bereba at different stages of irradiation. For each sample the lowest spectrum is the virgin one. Labels refer to the irradiation stages reported in Table 1. Left panel: Ar+ irradiated samples. Right panel: Ar+ and C+ irradiated samples. See text for details.
Current usage metrics show cumulative count of Article Views (full-text article views including HTML views, PDF and ePub downloads, according to the available data) and Abstracts Views on Vision4Press platform.
Data correspond to usage on the plateform after 2015. The current usage metrics is available 48-96 hours after online publication and is updated daily on week days.
Initial download of the metrics may take a while.