Fig. 3
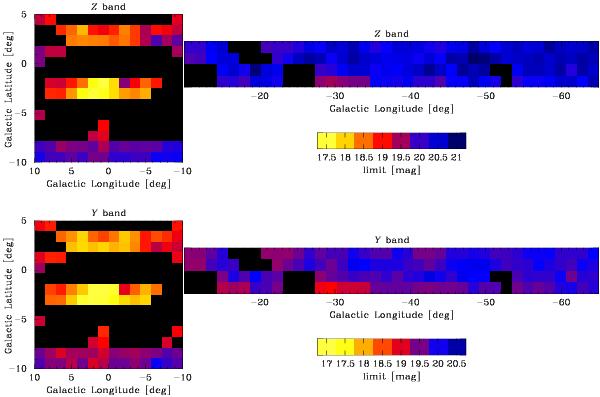
5σ magnitude limits of the catalogues in the Z- (top panel) and Y-bands (bottom panel). The colour scale is shown in each case. The completeness of the DR1 can be also checked on the maps, where the missing tiles appear in black. Exposure times in the bulge and disk fields are different (see Table 3), as a result the disk fields have deeper photometry. Similar maps for J, H and Ks photometry, and for the variability campaign are presented in Figs. 4 and 5.
Current usage metrics show cumulative count of Article Views (full-text article views including HTML views, PDF and ePub downloads, according to the available data) and Abstracts Views on Vision4Press platform.
Data correspond to usage on the plateform after 2015. The current usage metrics is available 48-96 hours after online publication and is updated daily on week days.
Initial download of the metrics may take a while.