Fig. 1
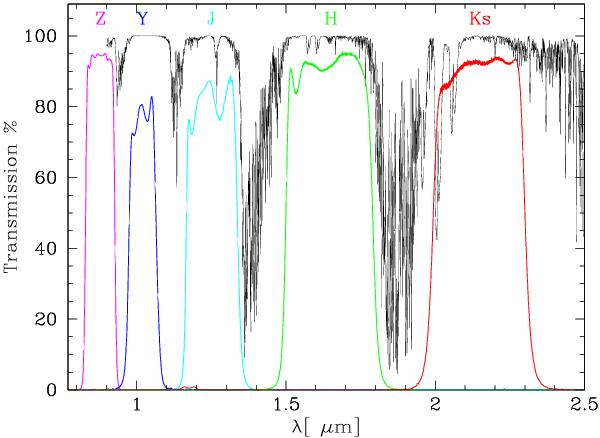
Transmission curves for the five broad-band filters present at the VIRCAM: Z, Y, J, H and Ks, compared with the typical atmospheric transmission profile for airmass = 1.0 and 1.0 mm water vapour. The effective wavelengths for all filters are listed in Table 1.
Current usage metrics show cumulative count of Article Views (full-text article views including HTML views, PDF and ePub downloads, according to the available data) and Abstracts Views on Vision4Press platform.
Data correspond to usage on the plateform after 2015. The current usage metrics is available 48-96 hours after online publication and is updated daily on week days.
Initial download of the metrics may take a while.