Fig. 1
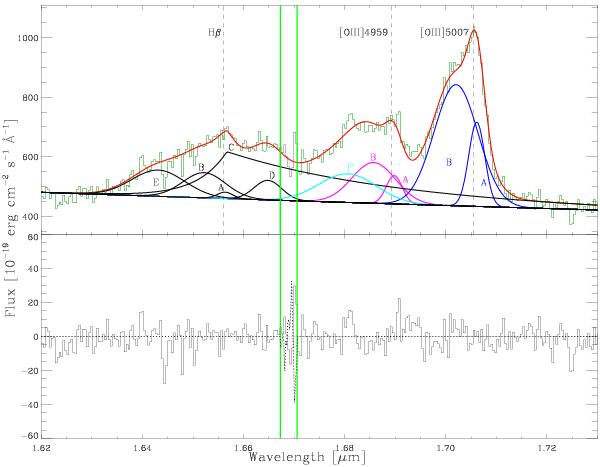
Upper panel: 2QZ0028-28 H band spectrum extracted from the central 0.5 arcsec, along with the various components used for the fit (see Appendix A for details). Vertical dashed lines indicate the rest frame wavelength of each line, by taking the [OIII]λ5007 line peak for reference. Lower panel: residuals of the fit. The green vertical lines enclose a the spectral zone affected by strong sky line residuals.
Current usage metrics show cumulative count of Article Views (full-text article views including HTML views, PDF and ePub downloads, according to the available data) and Abstracts Views on Vision4Press platform.
Data correspond to usage on the plateform after 2015. The current usage metrics is available 48-96 hours after online publication and is updated daily on week days.
Initial download of the metrics may take a while.