Free Access
Fig. 3
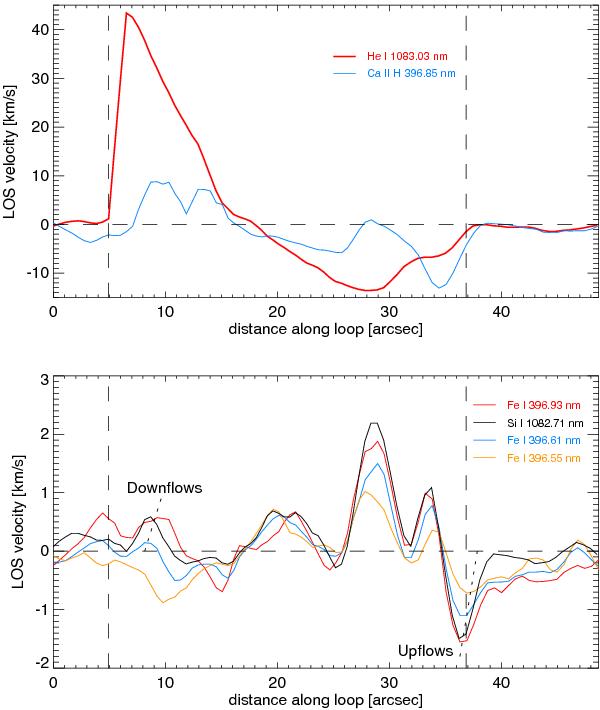
Line-of-sight velocities along the central axis of the loop structure under investigation. Top panel: chromospheric lines of He i and Ca ii H. Bottom panel: photospheric lines. The dashed vertical lines denote the inner and outer end of the structure. The dotted lines indicate the locations of upflows and downflows.
Current usage metrics show cumulative count of Article Views (full-text article views including HTML views, PDF and ePub downloads, according to the available data) and Abstracts Views on Vision4Press platform.
Data correspond to usage on the plateform after 2015. The current usage metrics is available 48-96 hours after online publication and is updated daily on week days.
Initial download of the metrics may take a while.