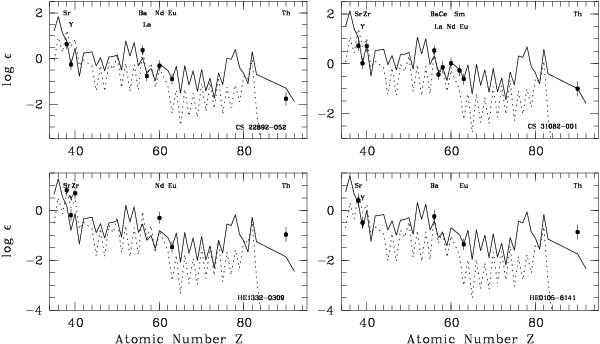
Fig. 8

Abundance pattern of CS 22892−052, CS 31082−001, HE 1332−0309 and HE 0105−6141, compared with the solar r-process pattern (solid line) scaled to the Eu abundance and the solar s-process pattern (dotted line) scaled to the Ba or Sr abundance of each star. The r- and s- fractions are from Arlandini et al. (1999), except for Th and U which are from Burris et al. (2000).
Current usage metrics show cumulative count of Article Views (full-text article views including HTML views, PDF and ePub downloads, according to the available data) and Abstracts Views on Vision4Press platform.
Data correspond to usage on the plateform after 2015. The current usage metrics is available 48-96 hours after online publication and is updated daily on week days.
Initial download of the metrics may take a while.


