Fig. 3
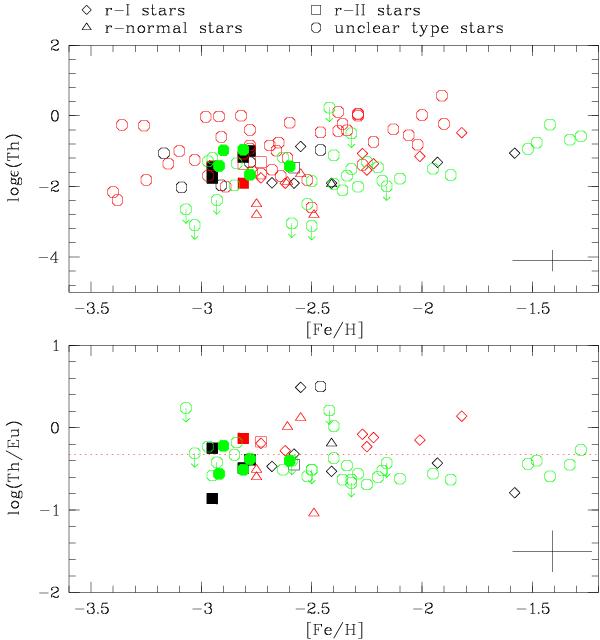
Plot of log ϵ(Th) vs. [Fe/H] and log (Th/Eu) vs. [Fe/H]. Detected results from this work are in black, and the upper limits are in red. Results from other studies are in green. These filled symbols are the stars in common with previous works. See text for the definations of different subclasses. A dashed red line is plotted in the lower panel corresponding to the “zero-age” log (Th/Eu). Averaged error bars are given at the lower right corner.
Current usage metrics show cumulative count of Article Views (full-text article views including HTML views, PDF and ePub downloads, according to the available data) and Abstracts Views on Vision4Press platform.
Data correspond to usage on the plateform after 2015. The current usage metrics is available 48-96 hours after online publication and is updated daily on week days.
Initial download of the metrics may take a while.