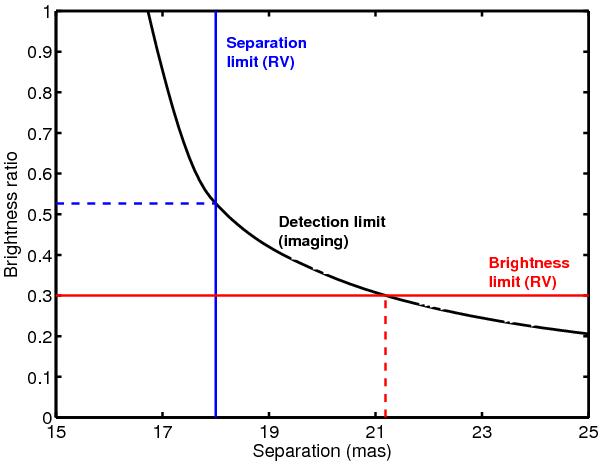
Fig. 3

Detection map of the NACO observations of CHXR 74. Displayed are the parameter space of detectable companions in terms of K-band brightness ratio and binary separation. The black curve denotes the detection limit for a S/N of 5. The blue vertical line represents the minimum binary separation (18 mas) at the time of the NACO observations and the red horizontal line the model-dependent lower limit of the K-band brightness ratio, both derived from the RV orbit. See text for more details.
Current usage metrics show cumulative count of Article Views (full-text article views including HTML views, PDF and ePub downloads, according to the available data) and Abstracts Views on Vision4Press platform.
Data correspond to usage on the plateform after 2015. The current usage metrics is available 48-96 hours after online publication and is updated daily on week days.
Initial download of the metrics may take a while.


