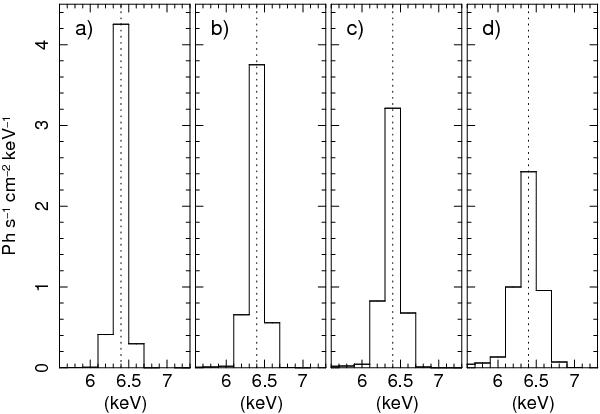
Fig. 6

A narrow Gaussian was simulated at redshifts a) z = 0, b) z = 0.5, c) z = 1 and d) z = 2, as observed with the EPIC pn, and then converted to a rest-frame spectrum after correcting for detector response and redshift for individual sources in the stacking sample. The rest-frame line energy is accurately recovered. The line profiles of higher redshift objects broaden because the energy resolution, (ΔE/E), of the detector becomes worse at lower energies. For this reason the line peak is lowered while the integrated line flux is recovered.
Current usage metrics show cumulative count of Article Views (full-text article views including HTML views, PDF and ePub downloads, according to the available data) and Abstracts Views on Vision4Press platform.
Data correspond to usage on the plateform after 2015. The current usage metrics is available 48-96 hours after online publication and is updated daily on week days.
Initial download of the metrics may take a while.


