Fig. 3
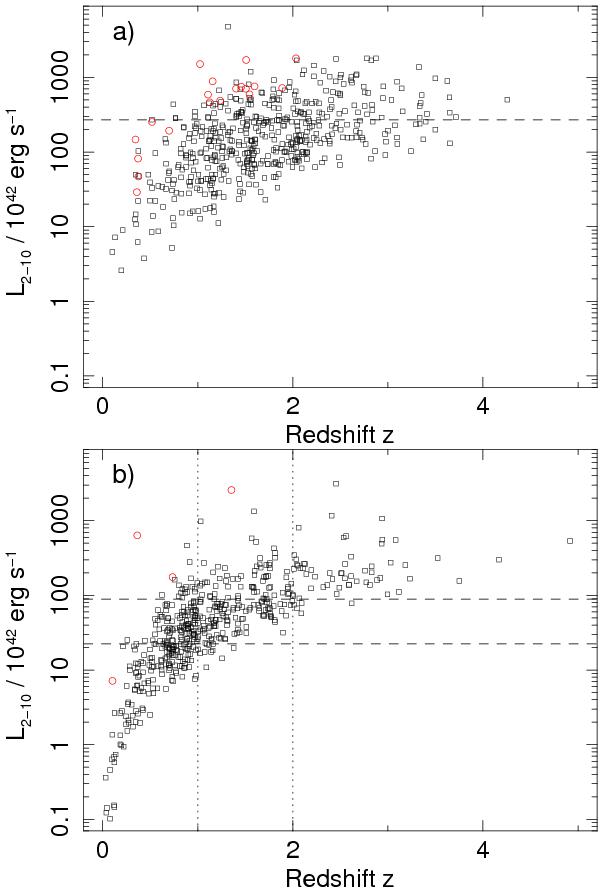
Distribution of sources in the rest-frame 2–10 keV luminosity-redshift plane for a) Type I and b) Type II objects. Sources in the main sample are indicated in black and the 23 sources in the bright sample are given in red. Luminosity boundaries for investigating spectral variations are indicated by dashed lines (Sects. 5.1.1, 5.2.1). Redshift boundaries at z = 1 and z = 2 are also indicated for the Type II objects.
Current usage metrics show cumulative count of Article Views (full-text article views including HTML views, PDF and ePub downloads, according to the available data) and Abstracts Views on Vision4Press platform.
Data correspond to usage on the plateform after 2015. The current usage metrics is available 48-96 hours after online publication and is updated daily on week days.
Initial download of the metrics may take a while.