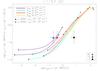
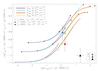
Fig. 6
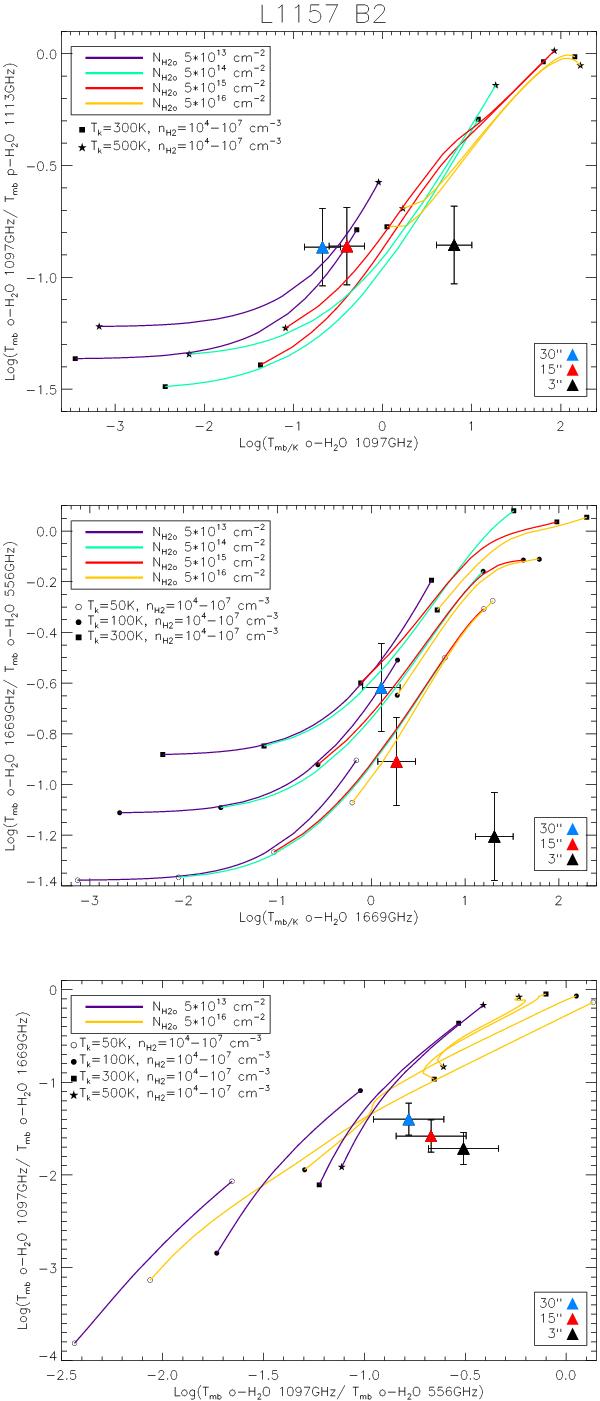
Analysis of the water line emissions in L1157 B2. o−H2O (312 − 303)/p − H2O (111 − 000) ratio versus o−H2O (312 − 303) (in logarithmic scale, top panel), o−H2O (212 − 101)/o−H2O (110 − 101) ratio versus o−H2O (212 − 101) (middle panel), and o−H2O (312 − 303)/o−H2O (110 − 101) versus o−H2O (312 − 303)/o−H2O (212 − 101) ratios (bottom panel), for non-LTE (RADEX) plane-parallel models at the labelled temperatures. A linewidth of 5.5 km s-1 has been assumed, according to the observed spectra. Each coloured curve corresponds to the labelled NH2O (see insert at the top-left corner). H2 density increases from left to right as the labelled values. Triangles with error bars indicate the size of the emitting region (30″, 15″, 3″).
Current usage metrics show cumulative count of Article Views (full-text article views including HTML views, PDF and ePub downloads, according to the available data) and Abstracts Views on Vision4Press platform.
Data correspond to usage on the plateform after 2015. The current usage metrics is available 48-96 hours after online publication and is updated daily on week days.
Initial download of the metrics may take a while.