Fig. 1
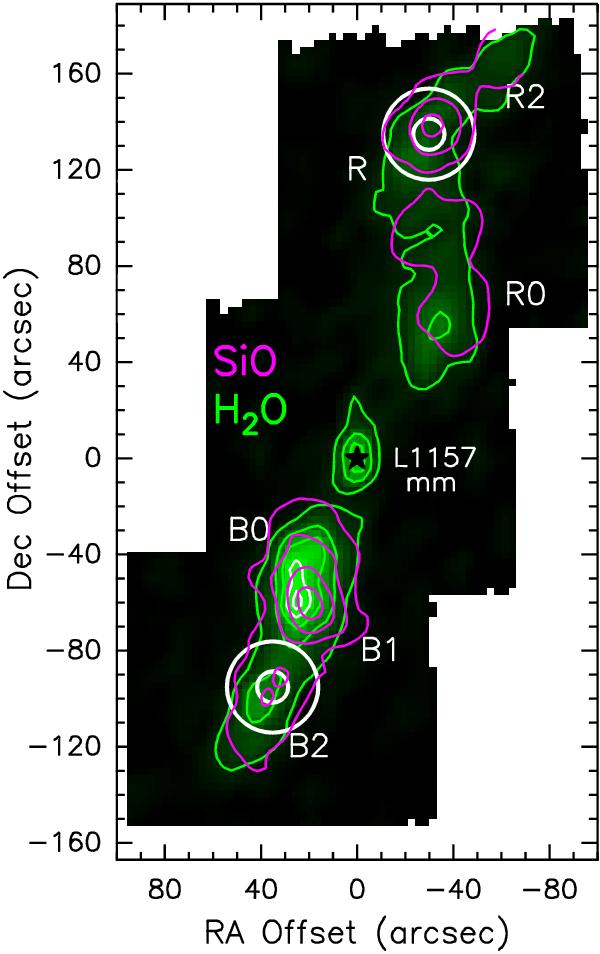
PACS image of L1157 of the integrated H2O emission at 1669 GHz (from Nisini et al. 2010). Offsets are with respect to the L1157-mm source, at coordinates αJ2000 = 20h39m06 2, δJ2000 = + 68°02′16
 0. The contours of the SiO 3-2 integrated intensity is superimposed on the water map with a spatial resolution of 18″ (Bachiller et al. 2001). The positions chosen for the HIFI observations (R and B2) are marked by two white circles, which correspond to the largest and the smallest HIFI beam sizes.
Current usage metrics show cumulative count of Article Views (full-text article views including HTML views, PDF and ePub downloads, according to the available data) and Abstracts Views on Vision4Press platform.
Data correspond to usage on the plateform after 2015. The current usage metrics is available 48-96 hours after online publication and is updated daily on week days.
Initial download of the metrics may take a while.