Fig. 9
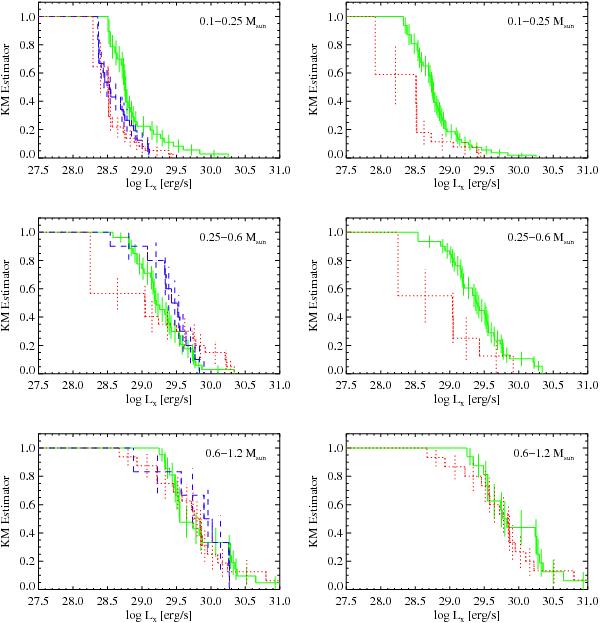
Cumulative distributions of X-ray luminosity for different subgroups of YSO in three mass bins (from top to bottom). The left panels represent three YSO classes based on IR excess (red dotted – Class II, blue dashed – Class II/III, and green solid – Class III) and the right panels represent YSO classes based on Hα emission (green solid – wTTS and red dotted – cTTS).
Current usage metrics show cumulative count of Article Views (full-text article views including HTML views, PDF and ePub downloads, according to the available data) and Abstracts Views on Vision4Press platform.
Data correspond to usage on the plateform after 2015. The current usage metrics is available 48-96 hours after online publication and is updated daily on week days.
Initial download of the metrics may take a while.