Fig. 6
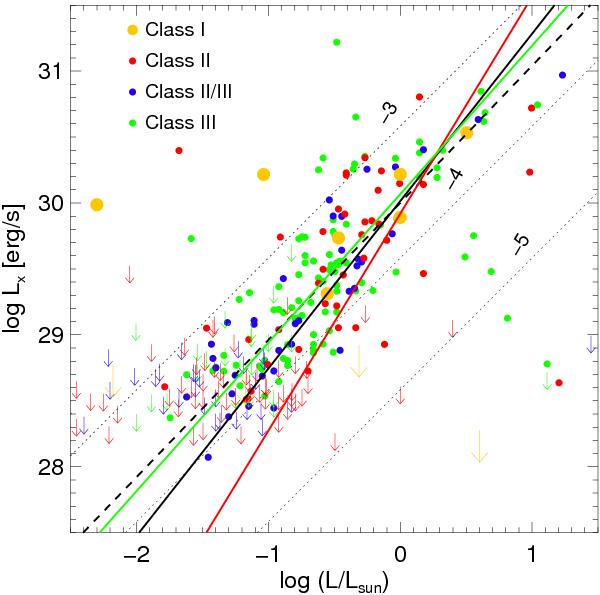
X-ray versus bolometric luminosity (a small number of objects, not relevant for this study, falls outside the plotted Lbol range); dotted lines represent constant Lx/Lbol ratios 10-3, 10-4 and 10-5; the dashed line is the linear regression fit derived by Preibisch et al. (2005a) for the ONC corresponding to log (Lx/Lbol) = −3.7; the solid lines are linear regression fits to the IC 348 members in the luminosity range log (L/L⊙) = −1.5... + 0.5, which corresponds roughly to the upper mass boundary of the Baraffe et al. (1998) models: black, red and green are for the whole sample, only Class II and only Class III sources, respectively.
Current usage metrics show cumulative count of Article Views (full-text article views including HTML views, PDF and ePub downloads, according to the available data) and Abstracts Views on Vision4Press platform.
Data correspond to usage on the plateform after 2015. The current usage metrics is available 48-96 hours after online publication and is updated daily on week days.
Initial download of the metrics may take a while.