Fig. 4
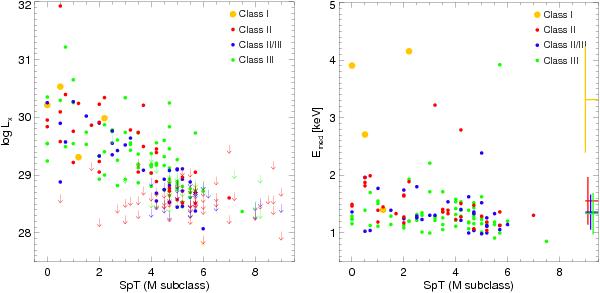
X-ray luminosity and median energy for the low-mass end of IC 348 versus spectral type. The color codes refer to different YSO classes (see Fig. 1). The colored lines in the right panel represent the mean of the median energy for each YSO group irrespective of spectral type and its standard deviation, i.e. including also higher-mass stars for which individual data points are outside the plotted range.
Current usage metrics show cumulative count of Article Views (full-text article views including HTML views, PDF and ePub downloads, according to the available data) and Abstracts Views on Vision4Press platform.
Data correspond to usage on the plateform after 2015. The current usage metrics is available 48-96 hours after online publication and is updated daily on week days.
Initial download of the metrics may take a while.