Fig. 2
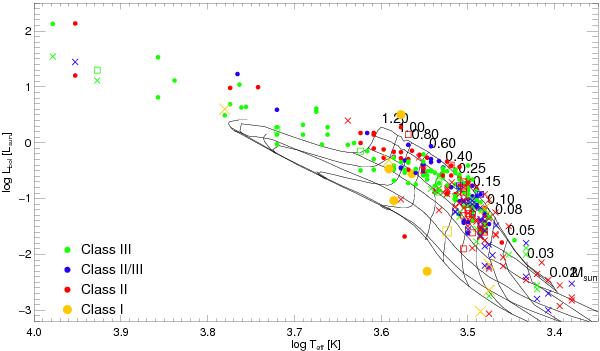
HR diagram for IC 348 compared to evolutionary tracks of Baraffe et al. (1998) and Chabrier et al. (2000). Isochrones are shown for 1, 2, 5, 10, 30, 100, 1000 Myr. The tracks are labeled in units of solar mass. X-ray detections are represented by filled circles and non-detections as crosses. IC 348 members outside the Chandra fields are shown as open squares. The objects are color − coded according to their YSO class (see definition in Sect. 2.2).
Current usage metrics show cumulative count of Article Views (full-text article views including HTML views, PDF and ePub downloads, according to the available data) and Abstracts Views on Vision4Press platform.
Data correspond to usage on the plateform after 2015. The current usage metrics is available 48-96 hours after online publication and is updated daily on week days.
Initial download of the metrics may take a while.