Free Access
Fig. 7
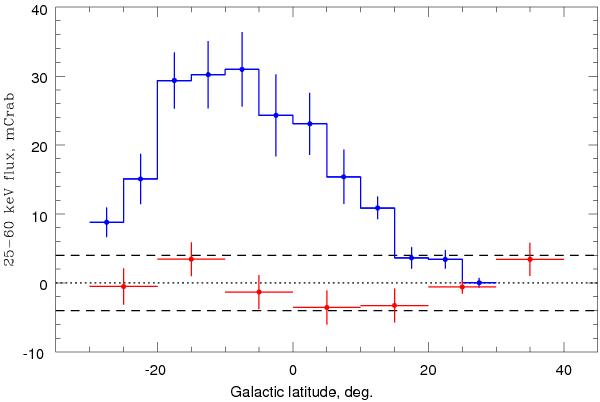
Source flux contribution (blue) and ISGRI detector background count rate residuals (red) averaged over the Galactic latitude. Error bars of the blue histogram represent rms-deviations of the summed point source fluxes from average in bin.
Current usage metrics show cumulative count of Article Views (full-text article views including HTML views, PDF and ePub downloads, according to the available data) and Abstracts Views on Vision4Press platform.
Data correspond to usage on the plateform after 2015. The current usage metrics is available 48-96 hours after online publication and is updated daily on week days.
Initial download of the metrics may take a while.