Fig. 6
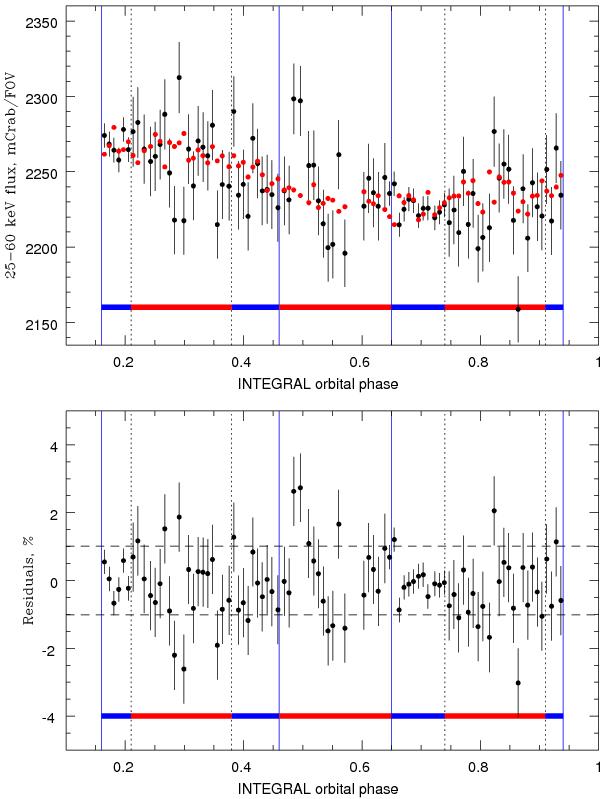
Upper panel: detailed view of detector count rate (black) during orbit 964 from Fig. 5. The blue and red areas denote observations made at |b| > = 20° and |b| < 20°, respectively. Bottom panel: residuals after subtracting the model-predicted count rate from the observed count rate. The black dashed lines represent a 1σ deviation (1.02%) from zero.
Current usage metrics show cumulative count of Article Views (full-text article views including HTML views, PDF and ePub downloads, according to the available data) and Abstracts Views on Vision4Press platform.
Data correspond to usage on the plateform after 2015. The current usage metrics is available 48-96 hours after online publication and is updated daily on week days.
Initial download of the metrics may take a while.